

Statistical Reporting Module (SRM)
SRM is the analytics layer of CPV-Auto™ that helps teams visualize trends and monitor limits with out-of-the-box support for control charts, quantile & probability plots, non-normal distribution fits, and many more to reveal trends, outliers, distribution fit, and process performance. Additional visualizations can be easily configured to match your analytical needs. and generate audit-ready reports from structured manufacturing data.
Turn approved data into real-time statistical insights for better process performance, quality, and data-driven decisions. It enables statistical analysis and visualization directly on data, eliminating the need for any prior data preparation.
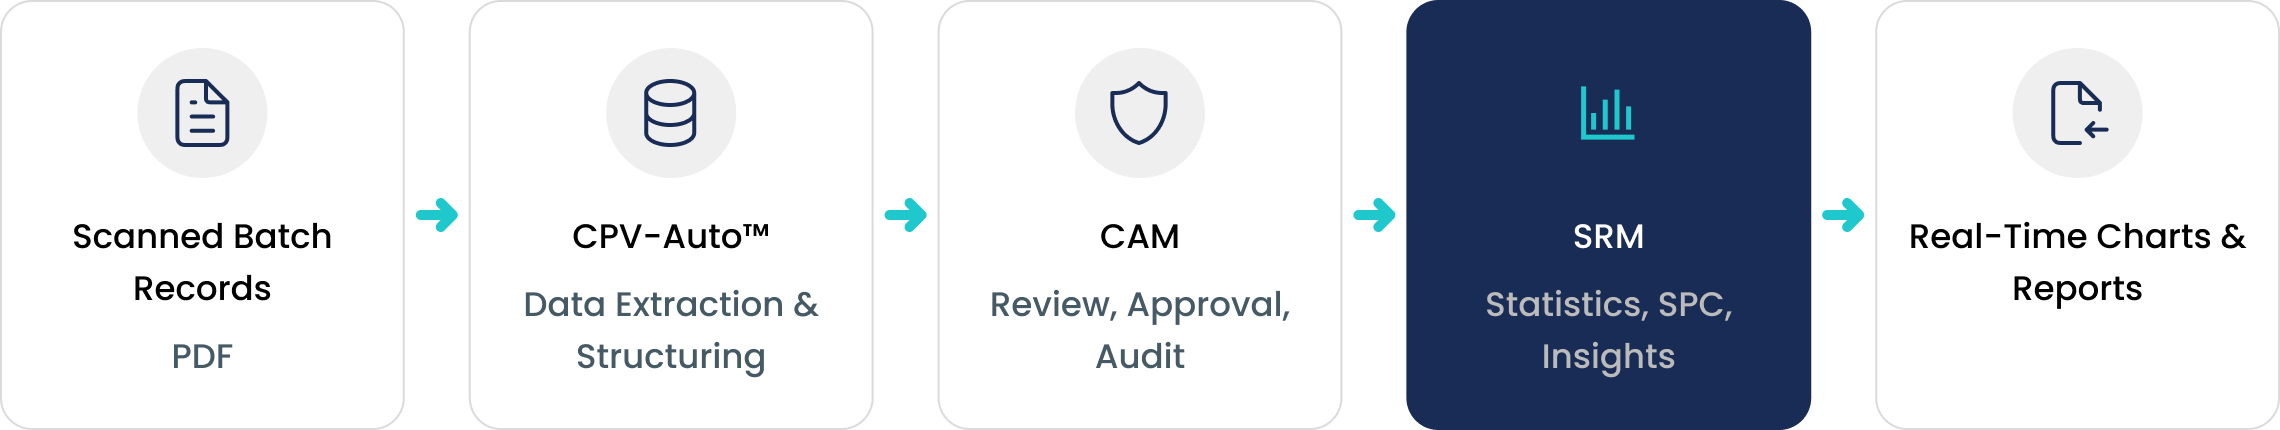
Where SRM Fits in the CPV-Auto™ Workflow
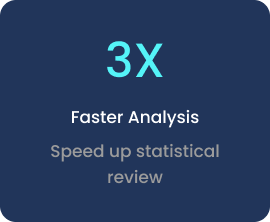
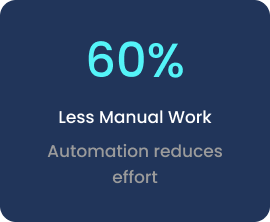
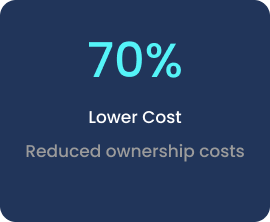
Business Impact
Intended Users
MSAT Teams
QA & Compliance
Process Development
Manufacturing Engineering
Operations Leadership
Designed for regulated biopharma manufacturing environments.
Core Capabilities of SRM
Four integrated capabilities that power your statistical analysis workflow

Unified Data Ingestion
Validated data from CPV-Auto™, MFT, & Excel in one platform.

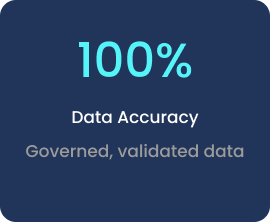
Governed Data Management
Validation rules, approvals, tracking, raw-data access, audit trails.

Smart Limits & Parameters
Control/specification limits & derived parameters for easy visualization.

Advanced SPC & Reporting
SPC charts, statistical analysis, deviation alerts,
DOCX/PDF reports.
SRM in Practice

Process & Parameter

Limits & Specifications

Batches Review

Control Chart Visualization

Process Capability Analysis

PP Chart Normality Analysis

Non-Normality Curve Fitting